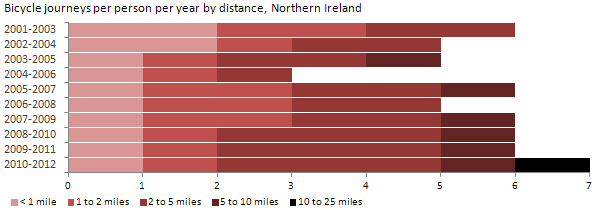
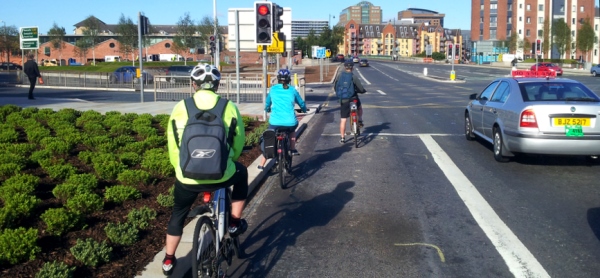
I was honoured to be invited to the first meeting of the Northern Ireland Assembly All Party Group on Cycling on 4th March 2014, and I decided to mark the occasion with a ham-fisted attempt at a series of infographics on local cycling issues.
There’s actually some decent data on local cycling (especially commuting) which shows some of the developing strengths and historic structural barriers and weaknesses. Unfortunately the information is difficult to find and digest at source, and not widely known. To better inform our engaged politicians and the wider public, here’s 15 infographics with some important messages.
Continue reading “Infographics // All Party Group on Cycling”

