Stand for a few moments in the centre of Belfast and you’ll see why many people think cycling is steadily rising here. Now official statistics from the Department for Regional Development (DRD) are beginning to support the anecdotes. The Northern Ireland Travel Survey (TSNI) 2010-12 released in July 2013 pointed to a spike in the number of cycling journeys, and now the detailed analysis lifts the lid off more headlines.

Belfast
Our most detailed count of Belfast commuter cyclists has been the census which in 2011 put cycling at 2.1% of all commuting journeys. But the TSNI has been reporting a higher number since 2005-2007, and it’s time to take ownership of this increase for our city – 3% of people commuting to work now do so on a bicycle. More people in Belfast use a bicycle to travel to work and home again than use the train.
Belfast now stands alone as the centre of cycling in NI, by average distance travelled per person. Over the last decade there has been a staggering increase to 55 miles cycled per Belfast resident each year compared to just 12 miles in 2001-2003. That’s the equivalent of everyone in Belfast cycling more than 1 mile a week instead of 1 mile a month a decade ago.

Northern Ireland
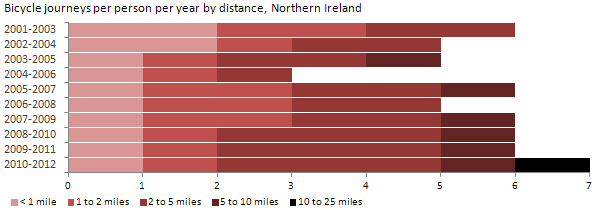
The upsurge in cycling across NI is most pronounced since 2006-2008, with the average person now making 7 trips a year by bicycle. Average journey length has also increased to just over 4 miles per trip for the first time.

Journey length
The profile of those cycling journeys is also changing. In 4 out of the first 6 years of the decade, the majority of cycling journeys were within a 2 mile range. Since 2008-2010 the majority of cycling journeys are now greater than 2 miles, and (for the first time) the average person in NI makes at least one cycling journey over 10 miles.

The increase in average cycling journey length is fairly unique among the main transport types in NI (excluding an analysis of bus transit for now). Looking at the change in journey length over the last decade shows average cycling journey distances have almost doubled. Average walking journey distances have also greatly increased. Average journey lengths by train, private taxi or when driving a car have remained static.

Total distance
It’s possible to track how the total miles travelled per person per year by different modes has changed over the decade. Again the bicycle shows the greatest upward trend, along with Northern Ireland Railways as people have responded to the significant capital investment in the railways. Although we saw walking average journey lengths rising, people in NI are making significantly less trips on foot, reduced from 182 per year in 2001-2003 to just 143, which explains why total miles travelled remains static over the decade. Total miles travelled by private taxi, cycling’s unfortunate rival over access to bus lanes in Belfast, is in freefall.

Gender
There remains a clear gender imbalance in Northern Ireland cycling (just 1 in 6 commuter cyclists are female) and there are some worrying trends. 34% of males cycled in the last 12 months compared to just 22% of females.

Female participation in cycling is sharply reducing in the 16-29 age bracket. Just under 2/3 of people under 15 years of age in NI have cycled in the last 12 months, yet even here a gender split may be emerging.

Overall 28% of the population has cycled in the last year, an increase from 27% in 2007-2009 (the first year of recording). This also means 72% of NI’s population aren’t cycling – a fantastic target market.
Bicycle ownership
Structural barriers to cycling remain at home, with no significant increase in bicycle ownership over the last 10 years. 61% of households in NI have no access to bicycles, just 3% better over 10 years. Data is not available at regional level to compare ownership in Belfast with the strong recent increases in usage.

Let’s build on this
In summary, there are some very encouraging signs of cycling starting to make an impact as a normal activity in Northern Ireland – more people are cycling more often and further than ever before. There is a real demand for cycling starting to emerge – the safer we make cycling, primarily through capital infrastructure intervention, the better the uptake will be.
This all benefits the general health of the population, the wealth of people who can choose to use their car less, and can begin to make a direct impact on congestion levels (especially in Belfast) with the right investment. The bicycle can also be an important tool of social inclusion when we take account of the TSNI figure that:

DRD has fired the starting pistol on a “cycling revolution”, and the TSNI figures begin to vindicate Minister Danny Kennedy’s decision to back cycling as a policy winner. Co-ordination in delivery plans with the Public Health Agency and the Department of the Environment (to name just a couple of stakeholders) will now be crucial to begin to embed this highly efficient and economically desirable transport form into Northern Ireland’s infrastructure.
The full Northern Ireland Travel Survey 2010-2012 is available to download from the DRD website.
Merry Christmas everyone!
….
More terrific statistical bloggery on cycling in Northern Ireland 😉
- Number Crunching: #BloodyCyclists
- Cycling safety deteriorating in Northern Ireland
- Socio-economics of Belfast commuter cycling // Gender
- Green cycle boxes: what’s the point?
- Socio-economics of Belfast commuter cycling // Deprivation
- Belfast workers getting on their bikes
- Northern Ireland cycling injury rates rising
- Belfast: a city with untapped cycle potential