Belfast, my home town, remains a very divided city in many ways – you just need to look at the recent ‘flag’ unrest for a quick snapshot of some key fault lines. Riding a bike doesn’t strike me as a particularly divisive activity – in fact it seems like a liberating, egalitarian way of travelling. The Dutch Cycling Embassy would say that in the Netherlands, people at all levels of society and income use the bicycle – “young or old, rich or poor, everyone cycles” – and why would it be any different in Belfast, even with tiny numbers by comparison? But are we overlooking some important details in the bigger picture?

In a city where commuter cycling modal share is only between 2.1% and 4% in 2011, and where the physical environment and perceived danger actively discourages people from cycling for transport, is bicycle ownership purely a luxury? Is there some truth to the suggestion that unhealthy city environments shape the urban cyclist population to be unnaturally male and middle class?
Detailed ward-level figures from the 2011 Census allows us to delve deeper into the mysteries of commuting choices in Belfast. Does the reality destroy such myths, or has the domination of the private motorist, and a city environment unsuitable for mass cycling, left key sections of our society behind? Part 1 of Socio-economics of Belfast commuter cycling, a short series of blog posts being released over 2013, looks at how cycling as a form of transport is unevenly distributed across Belfast.
Cycling across the class divide?
First to set the scene for those who don’t know, Belfast is a relatively small city, with low population density and a highly centralised employment and retail core. The city’s development, heavily affected by The Troubles, has left fractured communities sharply divided by religious background and class – although lines have begun to blur over the last 20 years. Leafy affluent suburbs mix with deprived inner city areas, more concentrated in the central core, west and north.
Crash course on the Belfast labour market
The five central wards with more than 10,000 employee jobs (Shaftesbury, Duncairn, Falls, Botanic, Island) account for 59% of employment in the city (map 1) with the only major employment centre outside the central spine being the Stormont area to the outer east, site of many government department offices. The labour market is split between approximately 55% of workers travelling in from outside the city, and 45% who live within Belfast. But 75% of employed Belfast residents work within the city council area, so the internal labour market seems quite inwardly focused.
 [CC-BY-SA-3.0 (http://creativecommons.org/licenses/by-sa/3.0)], via Wikimedia Commons")
To look at how the population is distributed across the city, the Northern Ireland Multiple Deprivation Measure 2010 ranks areas of Northern Ireland according to a mix of:
- income deprivation (25% weight)
- employment deprivation (25%)
- health deprivation and disability (15%)
- education, skills and training deprivation (15%)
- proximity to services deprivation (10%)
- living environment deprivation (5%)
- crime and disorder (5%)
12 Belfast wards rank in the top 20 most deprived wards in the whole of Northern Ireland (out of 582). The MDM map above shows a clear divide in the south and east of the city, where some of the more affluent suburbs are situated. For this analysis, and plotted on the maps below, Belfast’s division into 51 electoral wards allows for a nice split into top 1/3, middle 1/3 and bottom 1/3.
Commuter travel choices in Belfast
Any city will have a vast array of daily journeys to work locations, but Belfast’s bus route map tells you about the dominant commuter traffic flows within the city – predominantly in a radial pattern between centre and suburbs. There is plenty of available data on commuting choices, not least the excellent DRD Northern Ireland Travel Survey which put Belfast commuter cycling modal share at a surprisingly high 4% in 2009-11. But for consistency, and the ability to delve into ward level data, we’ll stick with the recently released 2011 Census Key Statistics.
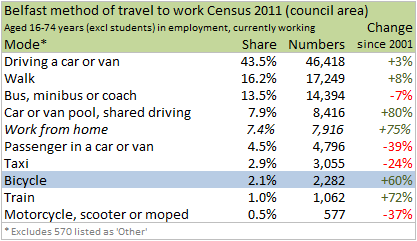
Belfast, being the main urban centre in the mainly rural Northern Ireland, is much more reliant on bus, walking and bicycle journeys to work, and significantly less reliant on the private car. However, all the various forms of car or van travel still accounts for around 60% of commuter journeys by workers living in Belfast.
Distribution of ‘sustainable’ commuting modes in Belfast
So bearing in mind the level and distribution of deprivation around the city, we can bring in 2011 Census ward level data on main mode of transport to work, split into walking, public transport (bus, train) and cycling. The data can then be ranked by percentage of all main modes of transport to work from each ward, grouping these into the top, middle and bottom 1/3s, and finally mapped to determine any patterns.
Walking is concentrated on the wards closest to the city centre, not surprisingly. The pattern certainly closely matching the most highly deprived areas, but we must be cautious about drawing conclusions here. Walking to work from the outer wards to the city centre would mean journey times of an hour or more – that and the physical effort perhaps making it the least attractive option.
 [CC-BY-SA-3.0 (http://creativecommons.org/licenses/by-sa/3.0)], via Wikimedia Commons")
Public transport usage, which is overwhelmingly by bus in Belfast (13.5%, against just 1% who take the train) is most concentrated in the more deprived wards in the north of the city, while the bottom 1/3 wards (same levels of Metro service across the city) show a close correlation to the least deprived areas of south and east.
Amalgamating the walking and public transport data, along with cycling, we can build up a picture of wards ranked by use of ‘sustainable transport‘ as the main mode of travel to work (table below). But does the cycling data match up to the developing pattern?
The overall shape of ‘sustainable’ transport in Belfast fits within a pattern of higher usage in more deprived areas, and lowest in the least deprived areas.
 [CC-BY-SA-3.0 (http://creativecommons.org/licenses/by-sa/3.0)], via Wikimedia Commons")
However, the cycling pattern is radically different; a heavy concentration of commuter cyclists within the more affluent areas of south and east, and wards with higher deprivation rankings in the north and west showing much lower percentages of cycling.
Taking a median MDM ranking from the top and bottom 1/3 wards for each of these categories, highlights the unique commuter cycling split across Belfast even more starkly.
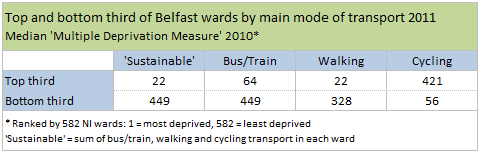
For bus/train, walking and all ‘sustainable’ transport, the median MDM rank of the top 1/3 wards is much higher (more deprived) than the bottom third. Cycling flips this on its head, showing higher modal share for cycling in areas of lower deprivation in Belfast.
With the greatest concentration of employee jobs and commuter flows into the city centre, we can rewind these journeys using 2001 Census data (2011 equivalent not available yet) to see where those bikes parked in workplace lock ups have arrived from. The top three wards by number of employee jobs in 2001, Shaftesbury, Duncairn and Falls, accounted for nearly half the employment in the city (46%). Looking at the number of cyclists in each ward making a journey to this central hub, we can again see the concentration in the more affluent inner south-east suburbs.
 [CC-BY-SA-3.0 (http://creativecommons.org/licenses/by-sa/3.0)], via Wikimedia Commons")
*Thanks to the NISRA Census Customer Service team for producing this ad hoc report
 There are certain structural issues which influence main mode of transport choices in Belfast. The last map shows a close correlation between areas of high deprivation and lower percentages of household car ownership, and the opposite true of areas of lower deprivation. But the concentration of cycle commuting also closely matches areas of higher car ownership, so perhaps the assertion that bikes are luxury items in Belfast may hold some truth at present.
The Netherlands is the only country in Europe to have more bikes than people. Across Northern Ireland in 2011, just 39% of households owned at least one bike, and less than a quarter own two or more, making an ‘accompanied’ journey possible. These structural issues must be addressed alongside investment in safer routes if a bigger impact is to be made across all levels of society.
Urban cycling for all?
So is cycling to work in Belfast a mainly middle class activity? It is of course impossible, unreasonable and undesirable to attempt to assign labels to every person within a particular area, and many wards in Belfast have a mix of streets where deprivation levels vary greatly. However we can see clear evidence of lower cycling uptake in the more deprived areas of the city, and a localised cluster of higher commuter cycling modal share in more affluent wards. We can speculate on some of the factors at work for people and families in areas of highest deprivation:
- high one-off cost to buy a commuter bike
- the number of deprived wards within walking distance of main centres of employment
- low concentration of leisure routes through communities in north and west Belfast eg Lagan Towpath in south, Comber Greenway in east
- outer wards in north and west situated higher in the hills, physical effort perhaps makes cycling seem less attractive
- larger concentrations of terraced housing stock providing less space for safe bike storage
- a Belfast ‘Troubles’ quirk – a cheap, efficient and social alternative in dedicated black taxi ‘bus’ routes
A more detailed study would be needed to draw clearer conclusions on this. There is some interesting research work on cycling perspectives within deprived inner-city areas, and perhaps this is a rich vein for study in Belfast.
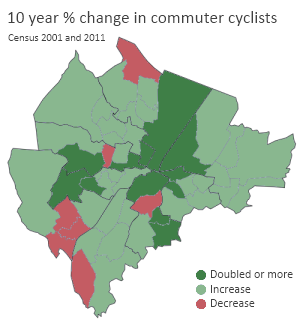
There is also some evidence that the 60% increase in commuter cyclists has been partly due to uptake in areas of higher deprivation, albeit from a low starting base in many instances. This is encouraging and needs to be built upon. One of the upcoming cycling projects in the city is the roll out of a council-led bike hire scheme. While this is more evidence of a growing awareness of cycling as a key urban transport mode, lessons from London should be heeded to ensure broad usage among all levels of society.
I’ve posted the partly financial reasons why I cycle to work in Belfast, and (excluding initial purchase and ongoing maintenance costs) cycling is effectively free transport. It seems reasonable to think that cycling should be viewed as a highly flexible and efficient form of urban transport, but also an option which weighs less heavily on a household budget than owning one or more cars. But it appears many people in the most deprived areas of Belfast are unable or unwilling to reap the many benefits of cycling.
There is a policy challenge here to assess why areas of Belfast are being left behind in adding cycling to their range of transport options, and to create city-wide conditions where cycling is a natural choice for everyone, not just the well-off.