I was honoured to be invited to the first meeting of the Northern Ireland Assembly All Party Group on Cycling on 4th March 2014, and I decided to mark the occasion with a ham-fisted attempt at a series of infographics on local cycling issues.
There’s actually some decent data on local cycling (especially commuting) which shows some of the developing strengths and historic structural barriers and weaknesses. Unfortunately the information is difficult to find and digest at source, and not widely known. To better inform our engaged politicians and the wider public, here’s 15 infographics with some important messages.
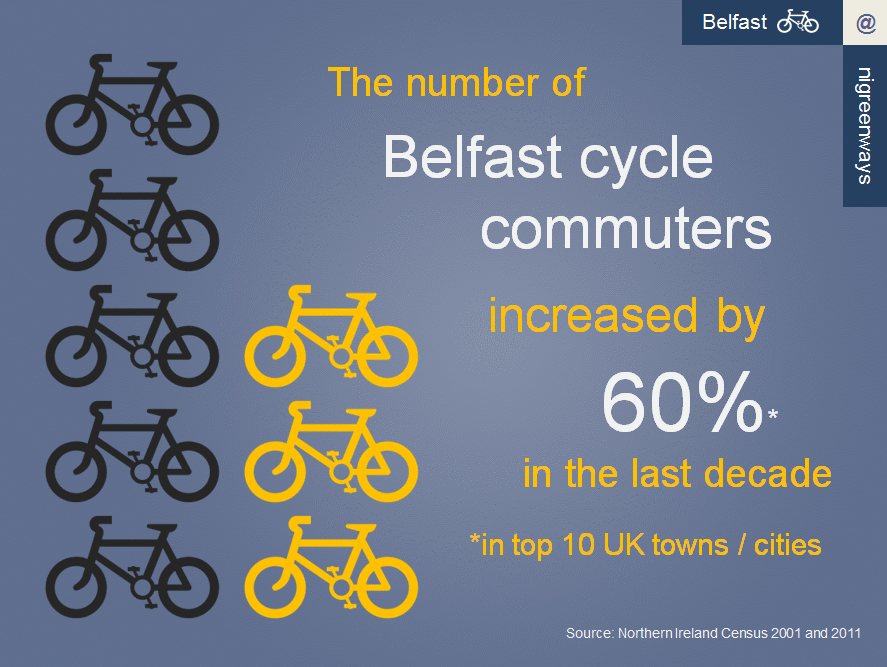
A quiet revolution in Belfast cycle commuting
This fact worth celebrating was missed by the DRD Press Office, and Northern Ireland didn’t make it onto this list of cities and towns with the best cycling progress recorded by the Census. As it was, Belfast had the 9th largest increase among large UK urban centres in the last decade. In the same period, cycle commuting in the rest of NI dropped by 12%, showing why the cycling investment focus should fall on Belfast in the coming years. [Source: NISRA]
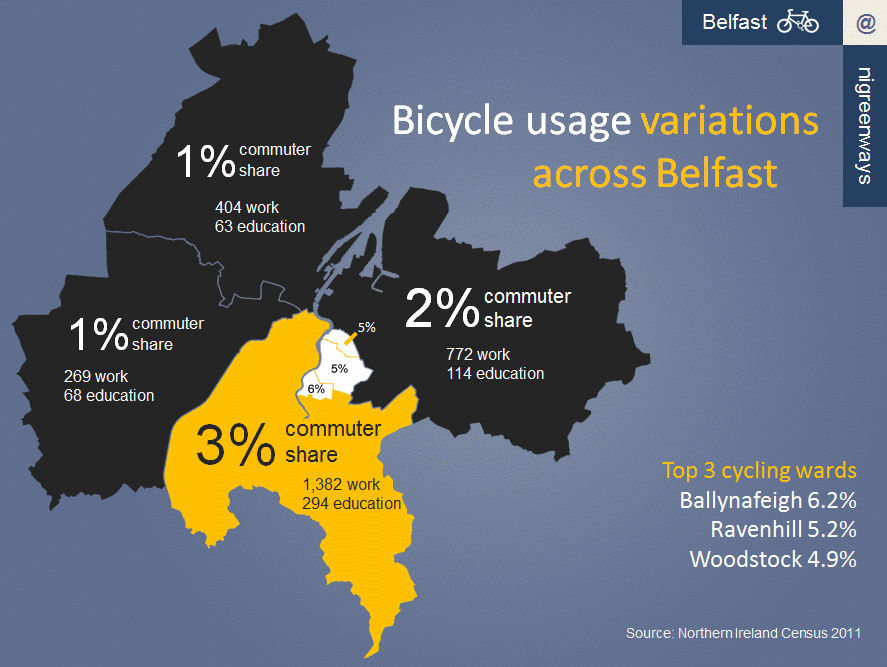
Belfast’s cycling landscape is not uniform
North and West Belfast remain some distance behind South and East Belfast in terms of cycling uptake. It’s truly shocking that the number of kids cycling to primary or secondary school or university struggles to reach triple figures outside South Belfast. There are structural issues at work behind the commuter statistics, not least in terms of deprivation, and our unique black taxi ‘bus’ routes. But the ‘hotspot’ in the South is instructive – Belfast’s highest quality, most coherent cycling route is situated on the River Lagan, with the Lagan Towpath / Stranmillis Embankment / Laganside spine running right into the city centre. [Source: NISRA]
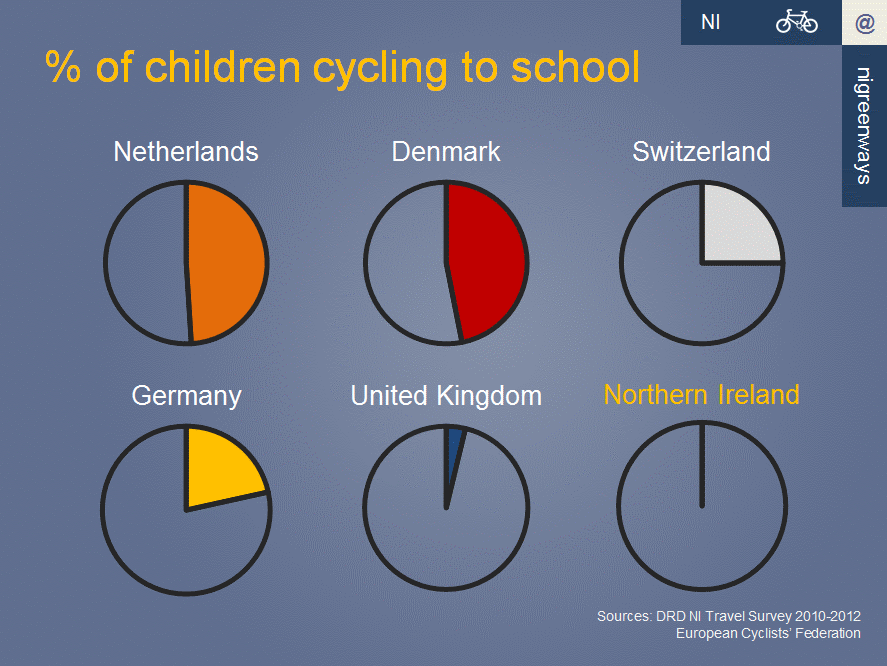
Now, about that childhood obesity crisis..
Over a fifth of Northern Ireland children entering Year 1 are either overweight or obese. Undercutting the UK’s shocking 2% of children cycling to school is some achievement, but Northern Ireland records a shameful 0%. Affording safe space to cycle, and the freedom and independence to cycle to school alone from an early age, is a bellwether of healthy, happy societies. The correlation between childhood cycling rates and the Netherlands’ position on the UNICEF child well-being ranking doesn’t go unnoticed. Sustrans in particular are doing good work in schools in Northern Ireland, but two main problems hold back childhood cycling here:
- our Programme for Government target mixes walking and cycling, so even a fall in cycling can be a success as long as it’s outstripped by a rise in walking
- you can’t train away (from kids or their parents) the perception and reality that routes to schools are full of fast impatient cars, and that our protected space for cycling is lacking
[Sources: DRD, ECF, Cycling Embassy of Denmark]
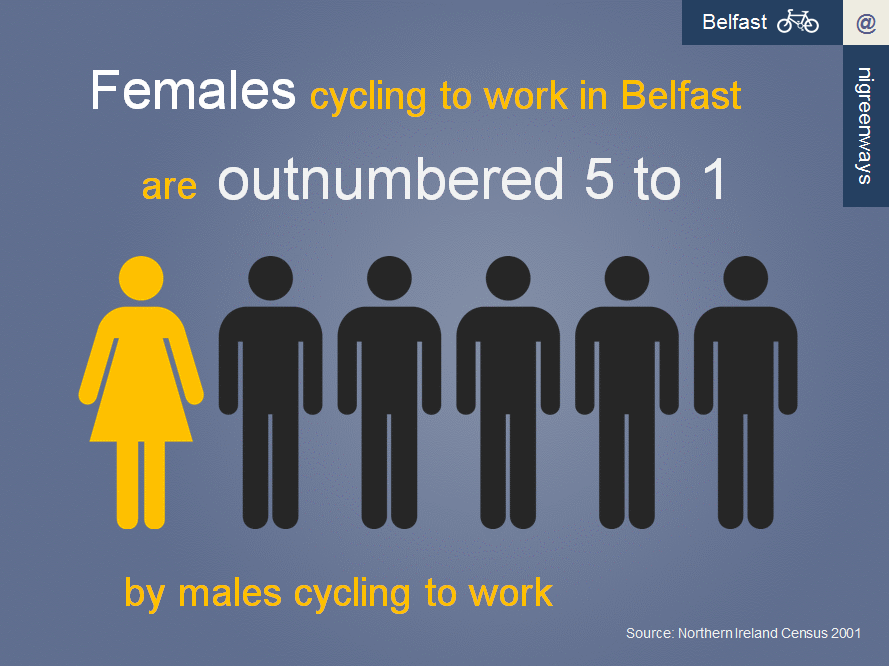
Cycle commuting is a male-dominated activity in Belfast
Another quick health check on any city is the balance of males and females cycling. The cycling landscape of Belfast is very different from the rest of Northern Ireland, but on this one measure there is parity. Male commuters are much more likely to see cycling as an option for transport. For comparison, in the Netherlands the national share of cycling is 55% female, 45% male. [Source: NISRA]
Sure, it’s lashing it down out there..
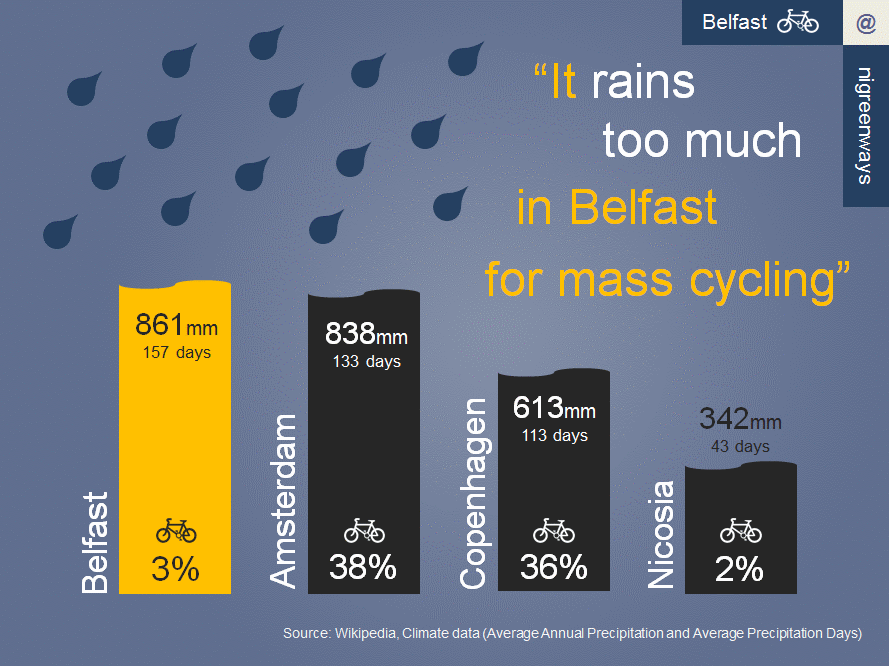
Okay, this is semi-serious, but how many times is Belfast’s weather the knee jerk reaction to a question about why someone doesn’t cycle? Forgetting for a second Billy Connolly’s line about “there’s no such thing as bad weather, just the wrong clothes“, do people really think places where cycling is common and normal are warm and sunny all year round? A quick look at average conditions in Amsterdam and Copenhagen (have you seen their winter?) might surprise, as would the cycling levels in freezing cold and wet Cyprus. Weather < efficiency of journeys, perception of safety, quality of routes, infrastructure.. [Source: Wikipedia]
You’d need your head examined..
But now we get to the crux of the issue – fear. People are not stupid, and make rational choices about transport. Clearly there is a problem when this many people will not cycle because the road environment in Belfast causes them to worry for their safety. As we saw in the earlier graphic, this affects parents’ decisions on allowing their children to cycle too. All of the hard work and money spent by government on on-road cycle training and cycling promotion is wasted without subjectively safe space for cycling, protected and joined-up routes, reducing conflict with vehicles and making cycling truly attractive for everyone. [Source: PARC Study]
And yet, the 60% might have a point..
With cycling remaining around 1% of all traffic in Northern Ireland, it’s staggering to see this deterioration in safety over the last 3 years. Up to 2009 the rate of cycling deaths and serious injuries was practically the same as pedestrians, yet since then cycling is almost twice as dangerous as walking (statistically speaking). [Sources: PSNI and DRD]
Cycling is a transport tool in a modern city
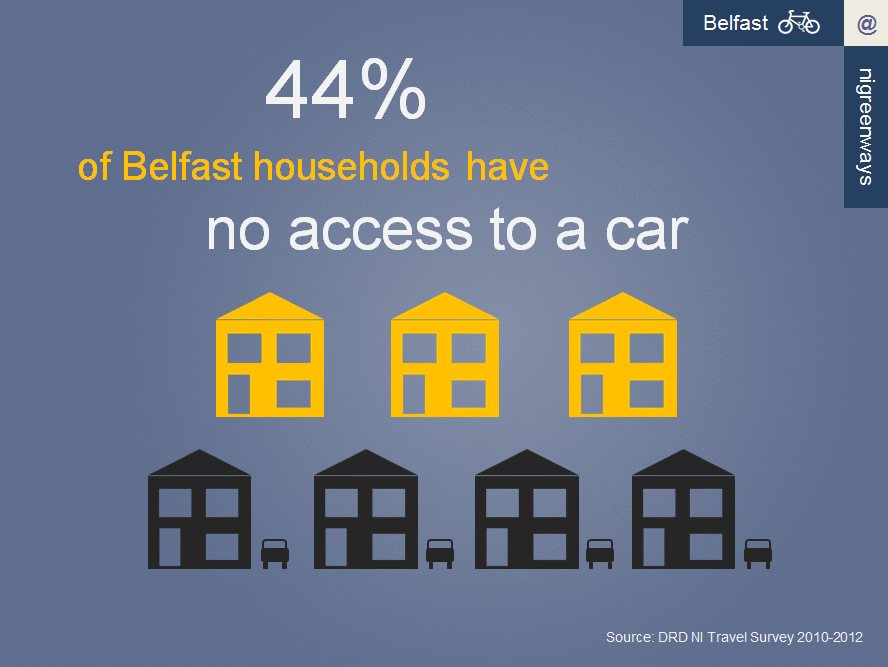
One thing often missing from the anger of politicians and business leaders to schemes like Belfast on the Move is an understanding of the low rate of car ownership in Belfast. Whether due to social factors, affordability, deprivation, or excellent transport links and the small size of the city, a sizeable portion of our population needs better public transport options. Building a cohesive city cycling network and attracting more people onto two wheels plays into a massive target audience. [Source: DRD]
Have bicycle, will travel..
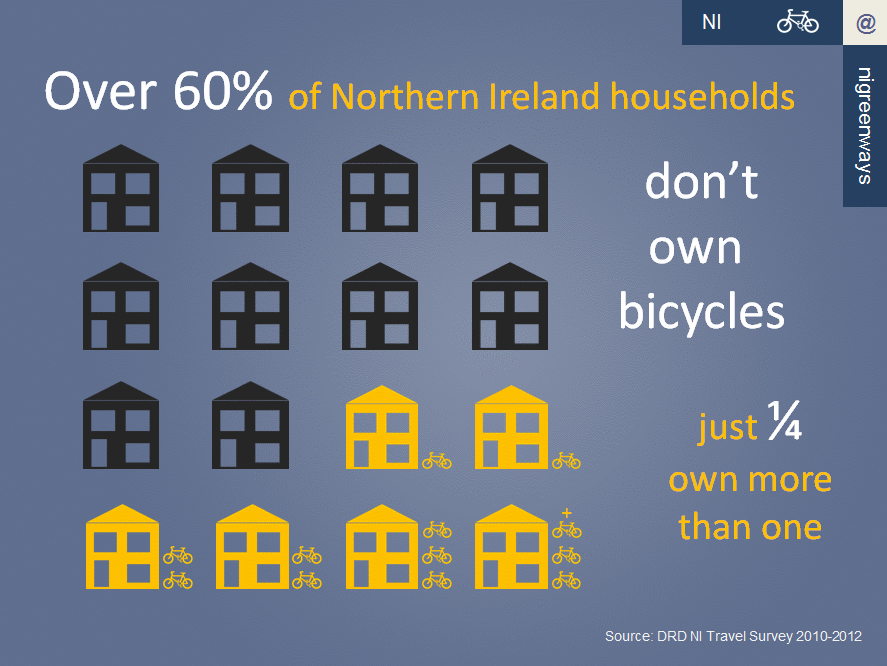
So – very few people cycle in Northern Ireland, and most people in Belfast think our roads are too dangerous. Is it surprising to see that so few households own bicycles? This is a long-term structural barrier which shows little sign of budging, despite good projects like the Cycle To Work Scheme. In the Netherlands there are more bicycles than people – maybe, just maybe, the difference is the infrastructure? You can lead a horse to water.. [Source: DRD]
Backing sustainable transport in Northern Ireland..
Fun fact – did you know that people in Northern Ireland make more cycling journeys than train journeys each year? It’s true, and while investment in the railways has reaped great benefits in increased patronage in the last few years, desperate under-investment in cycling leaves our rates among the lowest in Europe. The train and the bicycle aren’t in competition in most areas here, and both serve to get people out of their cars. 45% of journeys to work in Belfast of 2km or less are made in private vehicles – imagine how many of those journeys could be switched to the bicycle with real investment. [Source: DRD]
Talk is cheap..
Chronic under-investment is the reality for cycling in Northern Ireland (and it’s been even worse) with an average of just 58p per year per head of population over the last five years. The new DRD Cycling Unit plans to ramp up this investment in 2015/16 to £2.50 per head (£4.5m) and £4 per head thereafter (£7.5m). The Get Britain Cycling Report recommends a starting point of £10 annually per person, which Pedal on Parliament rightly points out isn’t going to bring about the kind of cycling revolution which Danny Kennedy talks about. Playing catch-up to Great Britain doesn’t show real ambition. Belfast has a real chance to power past the best UK and Irish cycling cities, given the right leadership, vision and (crucially) investment. [Source: DRD and Get Britain Cycling Report]
But we have cycle lanes already, right?
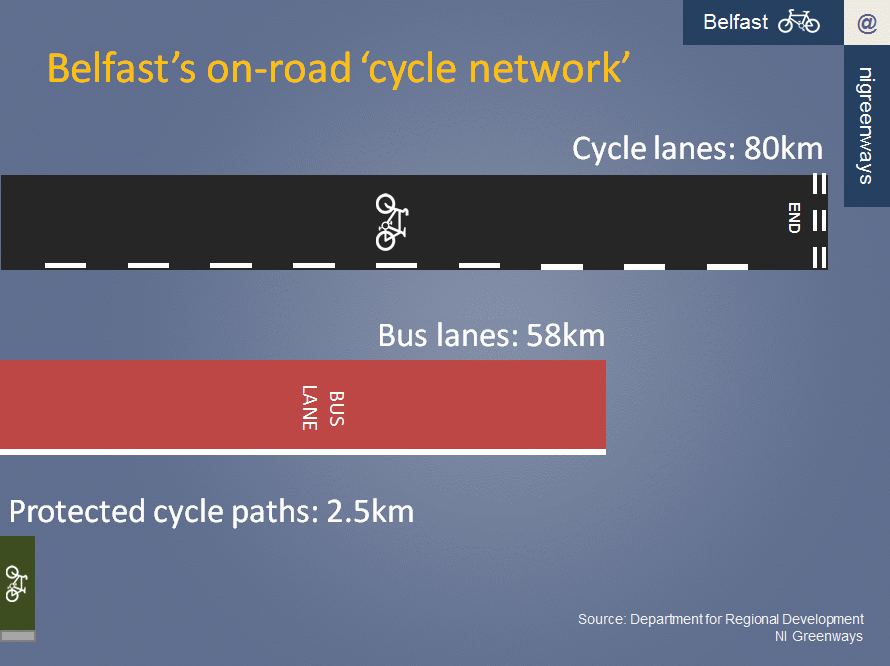
According to DRD, the cycle lane network in Belfast is more extensive than the bus lane network! Of course, DRD unfortunately relies on bus lanes as a major part of the (usually inbound) cycling network, another barrier for people intimidated by sharing spaces with buses. True #space4cycling is just that – something which isn’t shared space with pedestrians or large, fast and impatient vehicles. Belfast boasts just 5 stretches of protected cycle tracks (Stranmillis Embankment, Sydenham Road, Park Road, Victoria Street and the world-famous Bin Lane) amounting to a paltry 2.5km. Seville quickly built an 80 mile network of protected cycle space and grew cycling tenfold in a short space of time. Belfast could and should do something just as radical. [Source: DRD]
Cycle lanes – shared space that excludes cycling
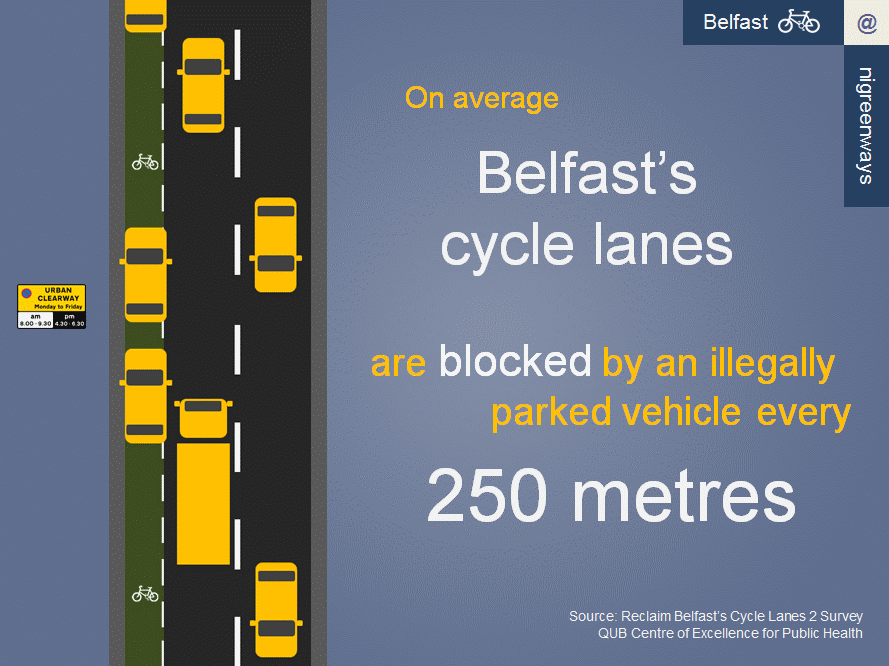
Ask anyone cycling in Belfast why they don’t use cycle lanes and the answer is simple – parking. The whole network is based on advisory cycle lanes – not enforceable, and effectively space shared with vehicles. Lanes lucky enough to have an urban clearway therefore become real cycle lanes for about 5% of the whole week. Except, drivers really don’t fear traffic wardens on many routes and park round the clock regardless. This is not #space4cycling. The Reclaim Belfast’s Cycle Lanes Surveys shone a light on the issue, and DRD’s parking enforcement section weren’t interested. [Source: NI Greenways]
And if you’re thinking “that infographic would make a great video” here’s a great video we made earlier..
[youtube http://www.youtube.com/watch?v=OvqGnlhWHGs?rel=0&w=600&h=338]
Build it and they will come..
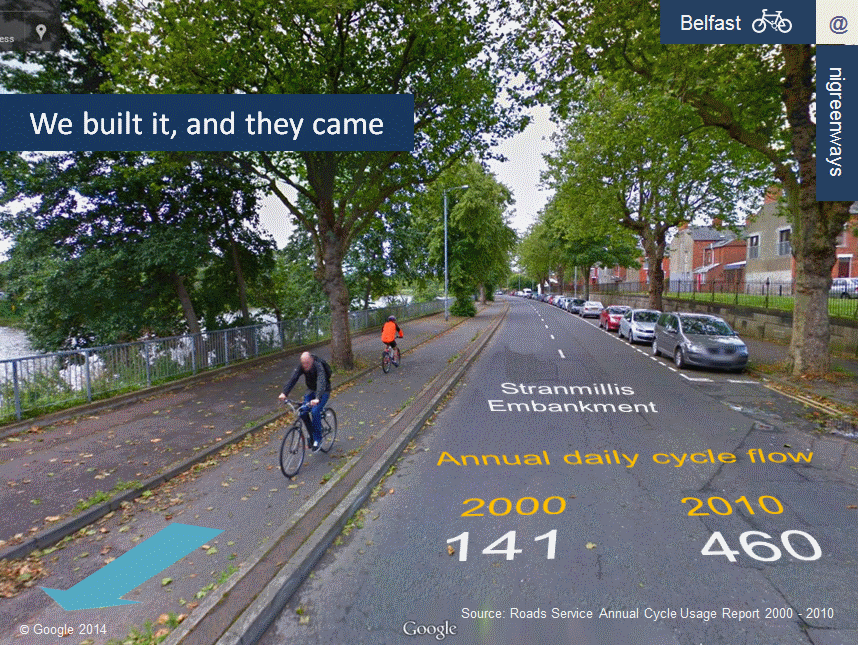
Even if you’ve been to Amsterdam and seen how the bicycle is catered for there, you might struggle to see how those principles can be applied in Belfast. Hell, even popular local cycling bloggers have struggled with the concept of applying principles of protected cycling space to the local environment, but they thankfully wised the bap soon after ; ) But just look to what DRD built on the Stranmillis Embankment over 15 years ago, and the effect it has had on cycling numbers. Any talk of pilot projects in our cycling revolution should be tempered – your real-world pilot is proven. Imagine if we could triple the cycling rates across the whole of Belfast in the next ten years.. [Source: DRD]
Belfast’s citizen cyclists are well ahead of your investment plans
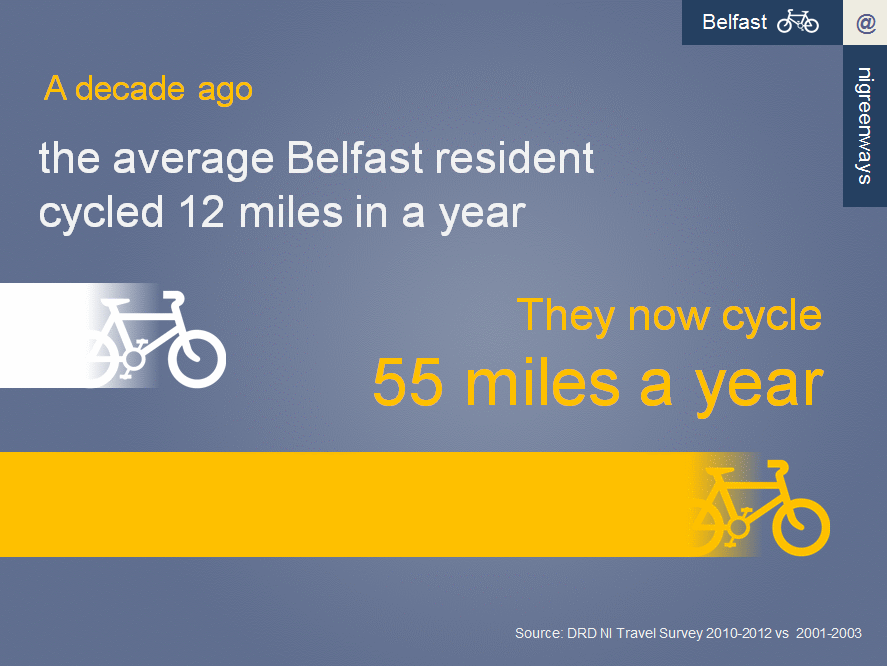
Remarkably over the last decade people in Belfast are simply finding their own way to cycling as a viable urban transport tool. This is the equivalent of everyone in Belfast cycling over 1 mile a week instead of 1 mile a month a decade ago. If DRD are consistent in one respect, their Press Office seems to miss most chances to publicise cycling successes. In this measure, as with most of the statistics on the infographics above, you’re likely to hear about them on this blog first. Nothing would make me happier than leaving that privilege in more capable official hands. [Source: DRD]
